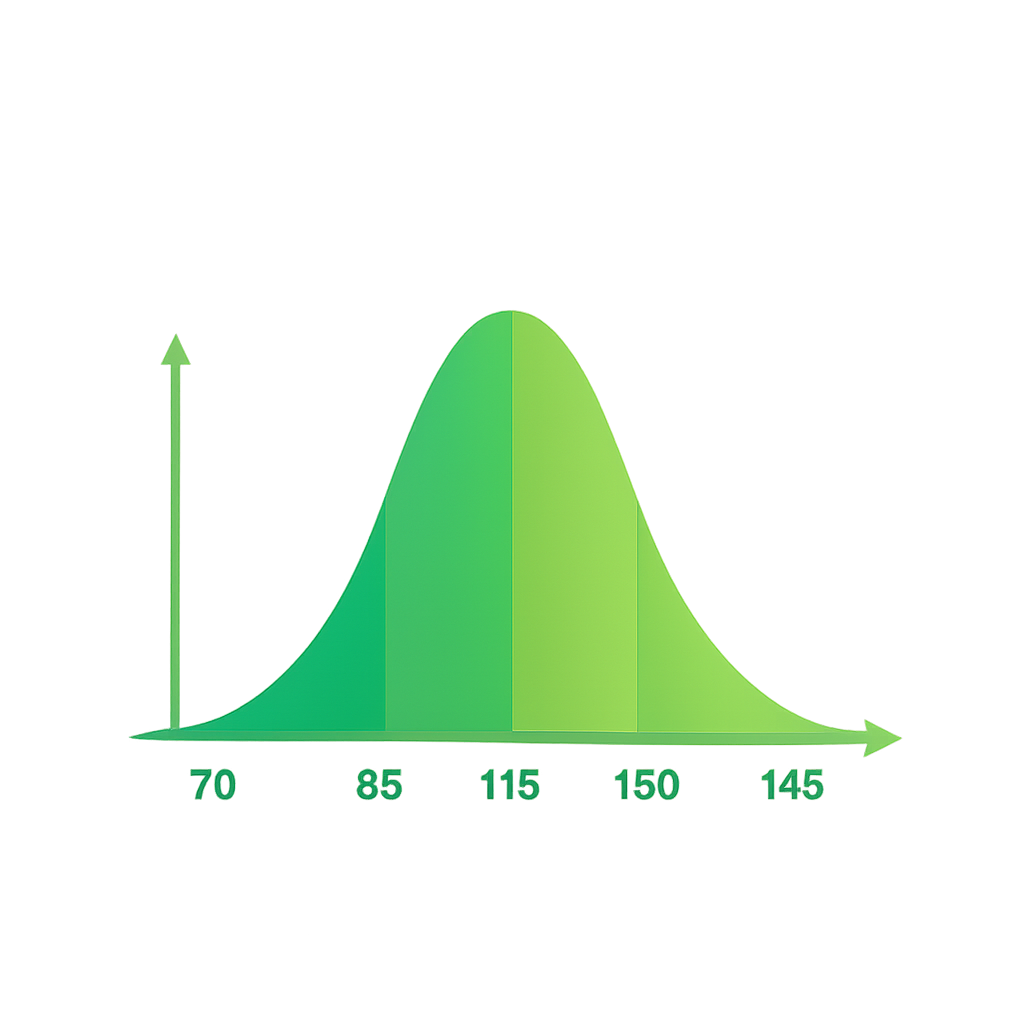
Get your free IQ percentile. Modeled after top in-person professional IQ tests.
Experience a professional-grade IQ test that follows established psychometric principles. Our adaptive system generates new questions each time you take the test, ensuring test integrity while maintaining consistent difficulty and scoring standards. Your percentile ranking is always free. How this test was made
Take the testInstant percentile for free with other metrics available for $10.
Pattern-based assessments inspired by leading professional tests like WAIS and Stanford-Binet.
We offer non-copyrighted tests historically accepted by Mensa (only in-person proctored attempts before public release are currently accepted).
Real IQ was developed using psychometric principles from leading professional intelligence assessments, but with a crucial difference: our adaptive system generates unique pattern recognition problems each time the test is taken, preventing answer memorization while maintaining consistent difficulty and scoring standards.
Start test
IQ (Intelligence Quotient) measures a person's cognitive abilities compared to the general population. Supported by decades of psychometric research, IQ is a well-established concept in psychology, often linked to outcomes like academic performance and career success. It reflects a person's overall cognitive capacity, often referred to as general intelligence (g).
The g factor represents the common thread across various cognitive tasks, capturing how well someone performs across diverse mental challenges. Research suggests that 50-80% of g variability may be influenced by genetics, with brain structure and neural efficiency also contributing. However, factors like education and environment can shape how cognitive abilities are expressed, and we approach g-loading metrics with cautious consideration, recognizing their limitations.
The CHC theory breaks down general intelligence (g) into specific cognitive abilities, offering a detailed view of cognitive strengths. Key components include:
These factors together provide a comprehensive picture of cognitive abilities, highlighting individual strengths and areas for growth.
Our tests are designed to align with the CHC framework, offering a structured and research-backed approach to measuring cognitive abilities. Unlike many online tests, we prioritize transparency and precision, using a dashboard to track and refine your cognitive profile over time. We acknowledge that g-loading metrics, often influenced by education or test familiarity, should be interpreted thoughtfully, and we encourage users to focus on their broader cognitive profile rather than a single score.
Our dashboard provides a key feature:
g Estimator: Located at the top, this tool estimates your general intelligence (g) based on all tests you've completed. The estimate improves in accuracy as you take more tests, with reliability metrics provided for context. We view g-loading as a useful but imperfect measure, potentially shaped by factors like education, so we present it as one part of a larger picture.
Our approach emphasizes a balanced understanding of cognitive abilities, encouraging users to explore their strengths while remaining mindful of the complexities behind metrics like g-loading.